
Aquaculture
Operational experience
Monitor oxygen and temperature in tanks and water conditions offshore. Local readings and historical charts help the team follow changes between site visits.
What the measurements help with
| Task | Measurements | Using the record |
|---|---|---|
| Conditions between tank inspections | Oxygen, water temperature and light in the tanks. | Follow changes on the local screen and inspect the history when a value departs from its usual range. |
| Water conditions offshore | Current speed, oxygen and temperature at several buoy locations. | Compare locations from the base station without a separate trip for each measurement. |
| Comparing days and seasons | A dated record from the measurement points. | Compare current conditions with a week, month or year earlier. Local viewing remains available without stable internet. |
From measurement points to the Hub
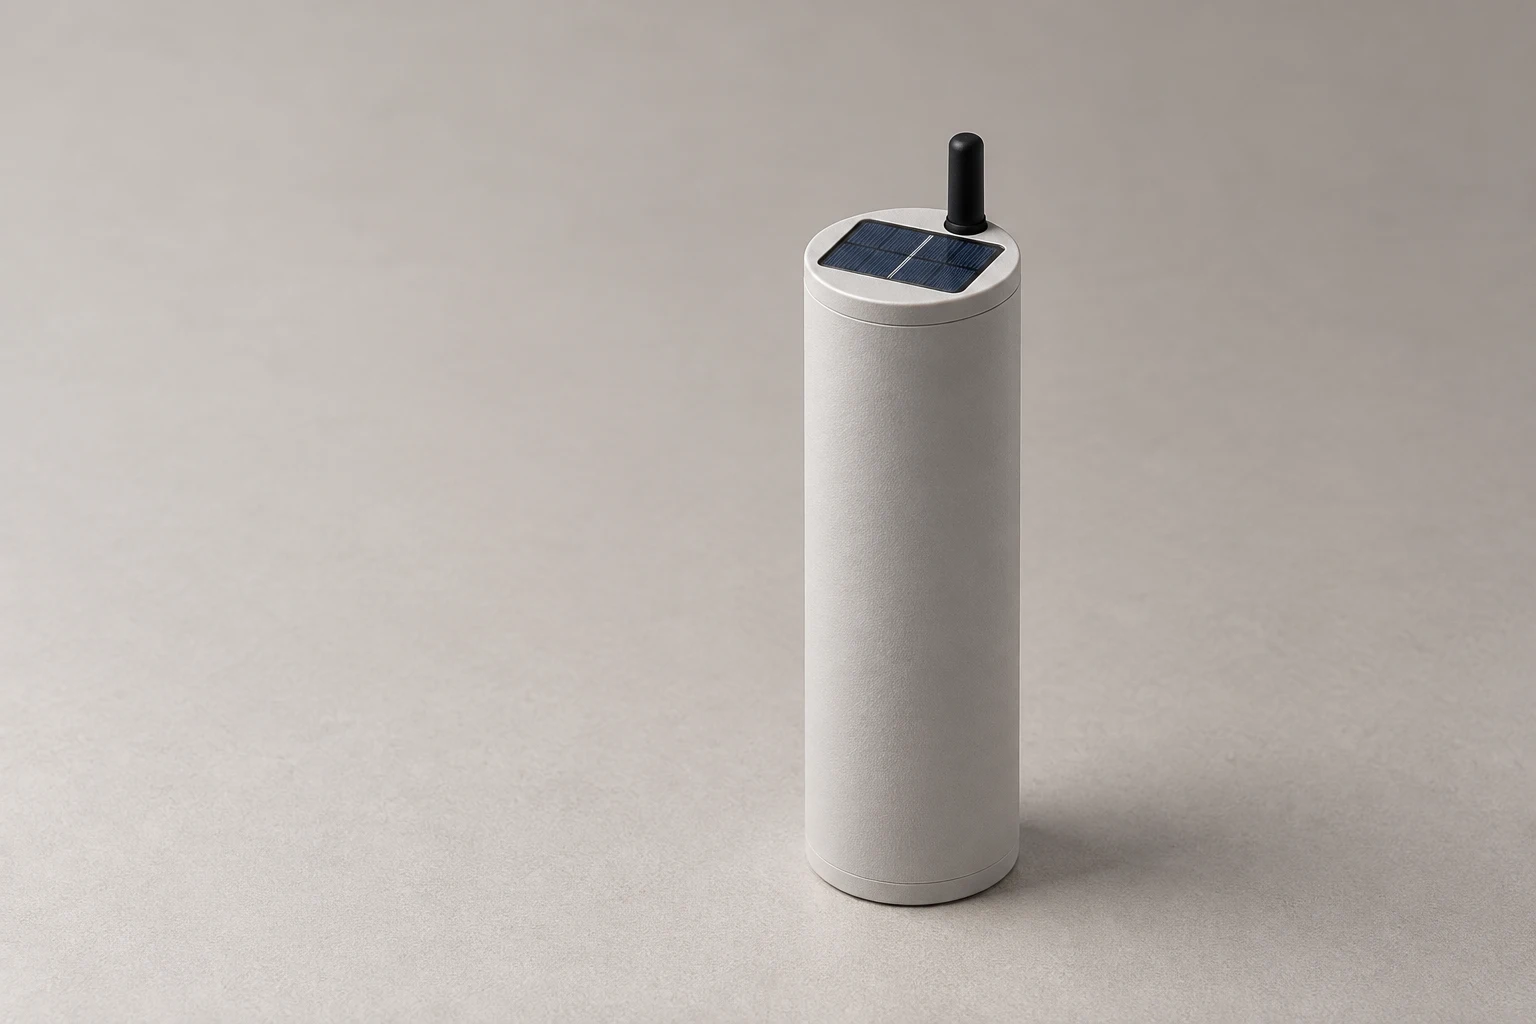
The measurements below come from the owner’s account of offshore and tank deployments. The layout illustrates the data path; it is not a customer site plan.
- Dissolved oxygen
- Water temperature
- Current speed
The customer project
Two years in operation. Measurement hardware and software connecting offshore buoys, on-site monitoring and cloud access.
What we can work on
- Temperature, oxygen and light in fish tanks
- Offshore measurements: current speed, oxygen, temperature and other water conditions
- Local access and cloud synchronisation
Start with your site
Start with the conditions you need to monitor and the decisions those measurements should support.
Define the measurement points, hardware, data collection and access around the site.
Discuss your site
Tell us about your site, what you need to measure and what is missing today. We can discuss existing devices or a system built for your needs.