
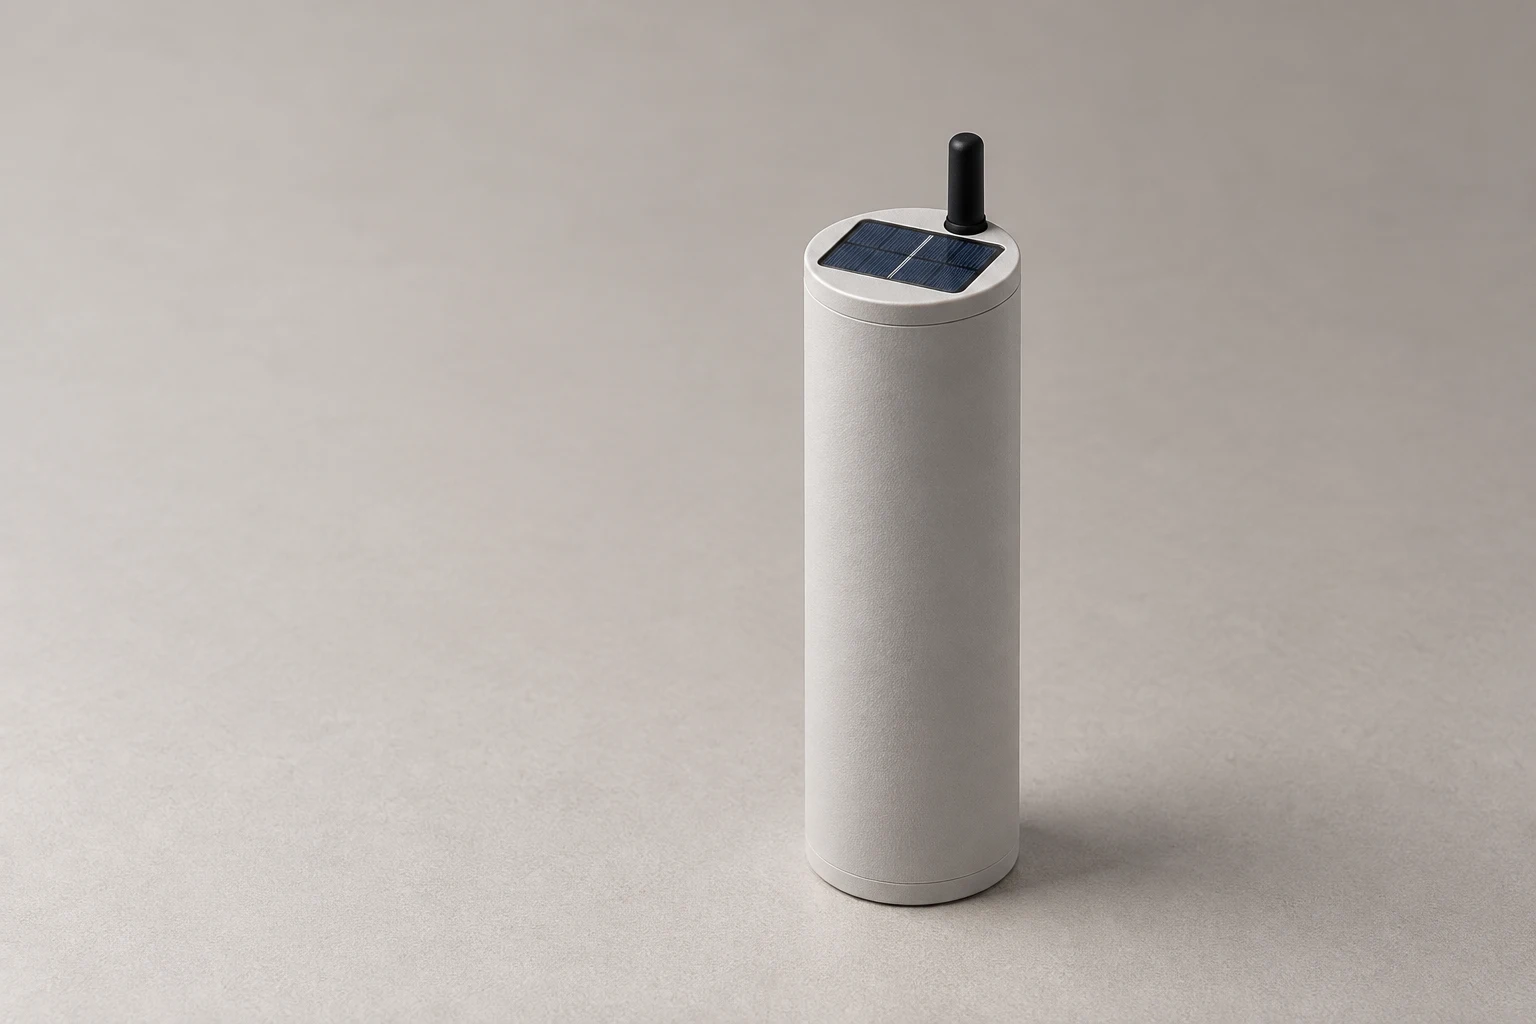
Aquaculture
Measurement systems for offshore sites and fish tanks, with local and cloud access.
- Dissolved oxygen
- Water temperature
- Current speed
Operational experience
About AquacultureXanthoria. Pronounced: [zan·thor·ee·uh]
Sensors, data collection and software for fish farms, fields and other sites. View current conditions and history locally, with cloud access when connected.
Buoys measure conditions at sea; sensors monitor the tanks. We developed the equipment, data collection and software for these customer deployments.
Choose a view to see how the Hub presents measurements. The interface opens in a browser on the local network.
Charts, gauges, heatmaps and notes on a screen arranged for your team.
Explore the Hub demoInterface schematic · illustrative data
The real Hub interface on an illustrative layout in Novik Bay, near Vladivostok. Stations and readings are fictional; the tank plan is a separate example.
Choose an application to see the measurements, system layout and related work. Each shows its current stage.
Measurement systems for offshore sites and fish tanks, with local and cloud access.
Operational experience
About Aquaculture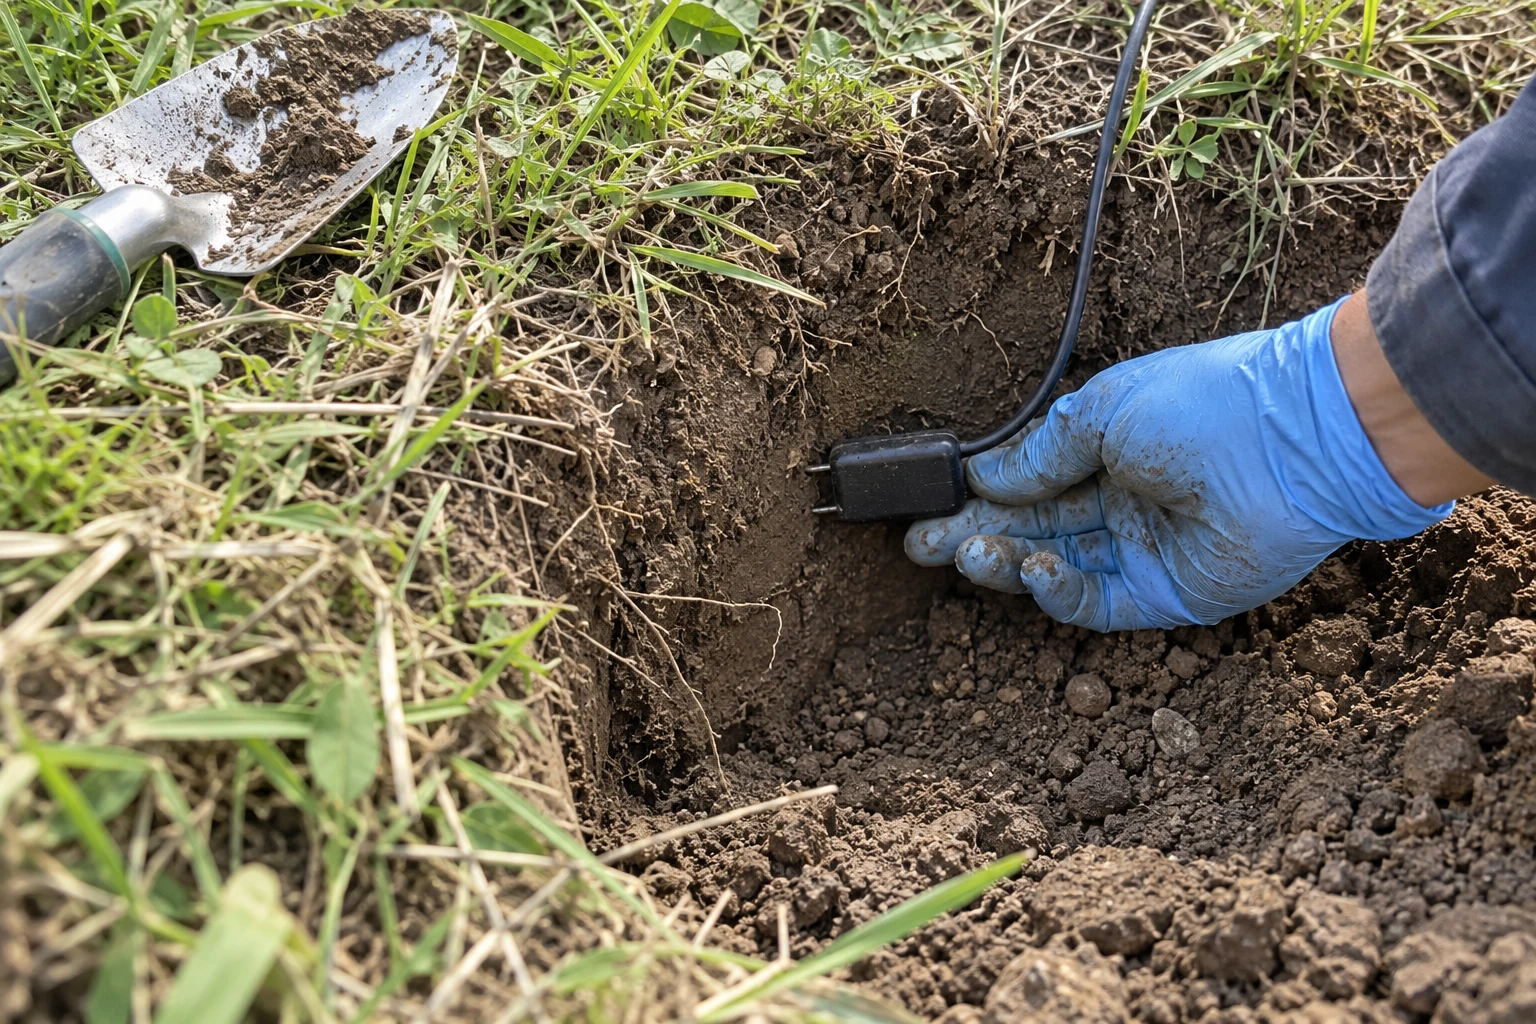
Soil measurements at several points, with a local archive for comparison.
Previous project experience
About Soil monitoringDeveloping hive monitoring around weight measurements and the needs of beekeepers.
In development
About Beekeeping & honey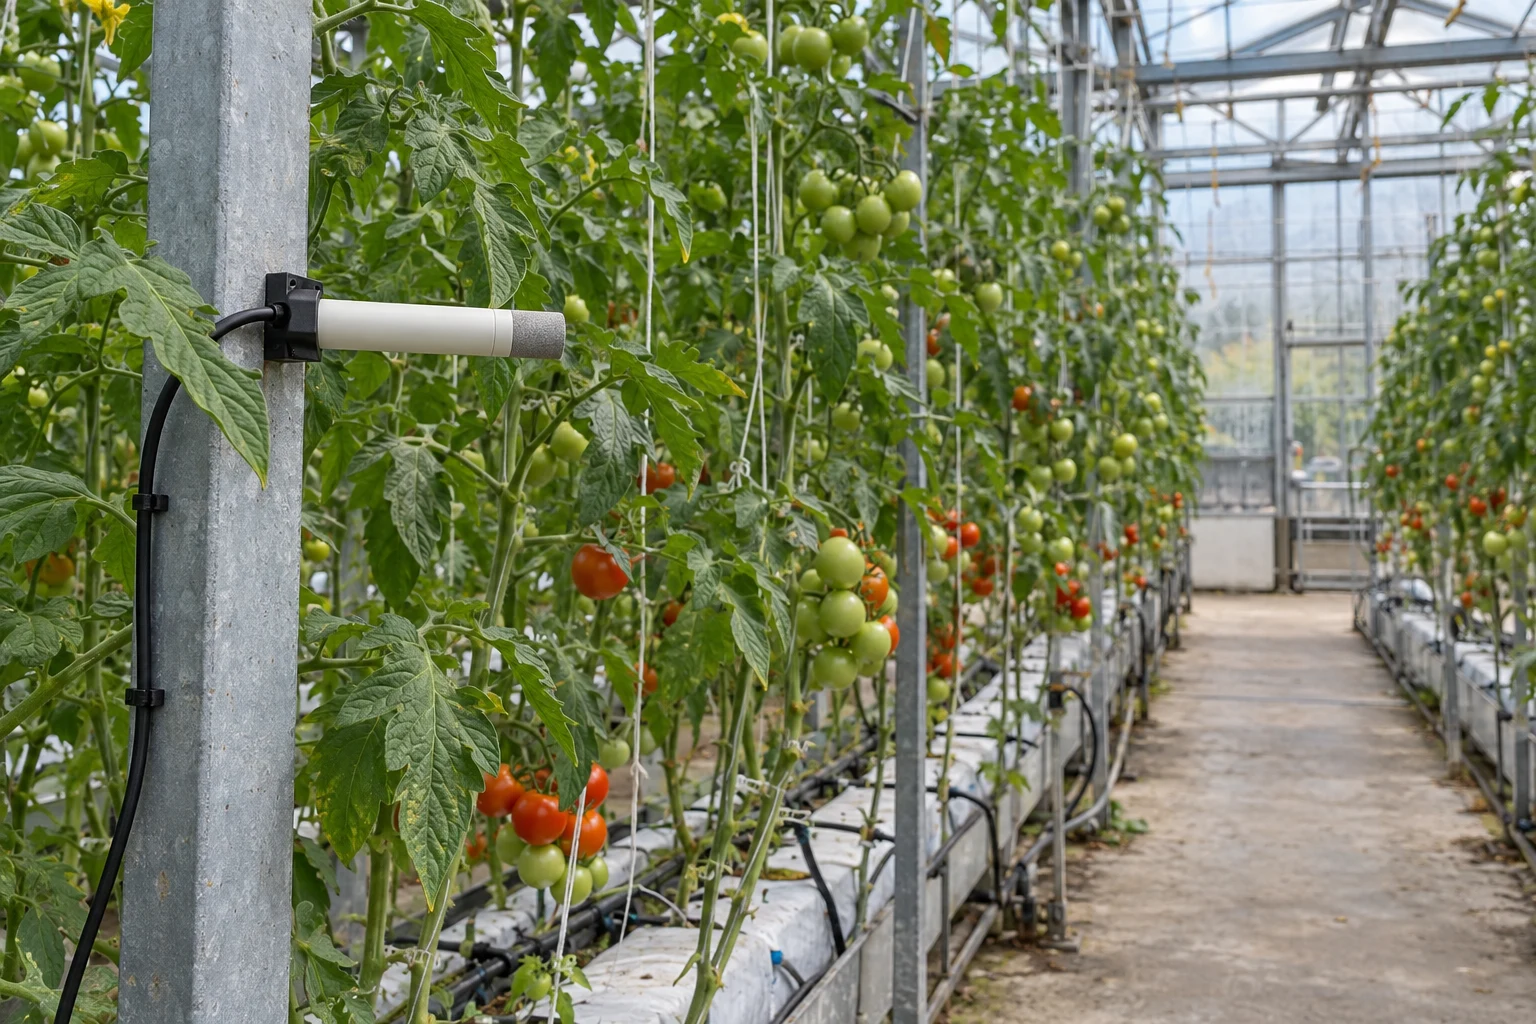
A proposed layout for comparing conditions across growing zones.
Open for bespoke projects
About GreenhousesFor a familiar measurement task, we can discuss existing water or soil devices, connection to a Hub and current availability.
Describe your siteFor a specific site, we define the measurement points, sensors, connectivity and software together. Existing equipment can be part of the system.
Describe your siteFor businesses, research teams and individual projects. You do not need to arrive with a technical specification.
Tell us about your site, what you need to measure and what is missing today. We can discuss existing devices or a system built for your needs.